Add a Heatmap to a Custom Report
To add a heatmap-style chart to a custom report:
- Go to Analyze and Report > Custom Reports.
- Select your report and click Edit.
- Click Design.
- Click the Insert tab.
- Click Report Container.
- Drag your mouse to create a report container.
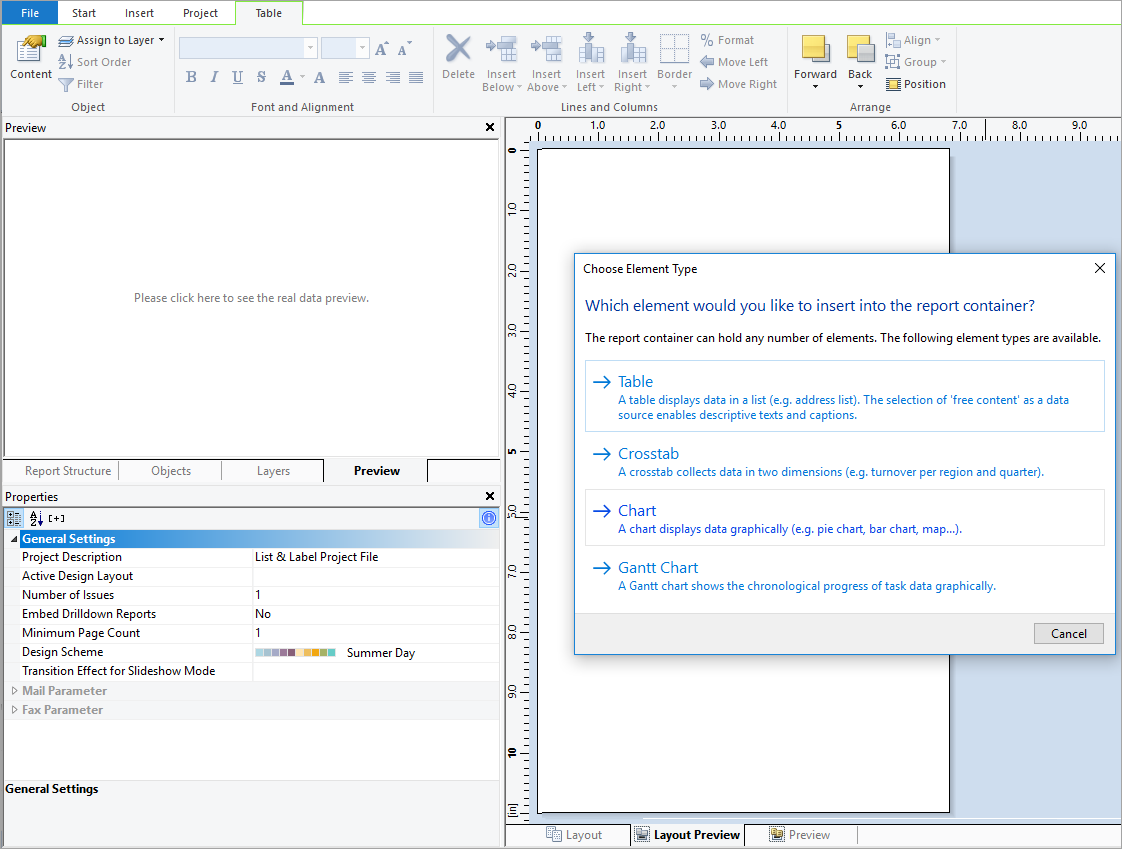
- Click Chart.
- Click Line/Symbol and select a chart.
- Click the Diagram Area tab > Background > Filling property.
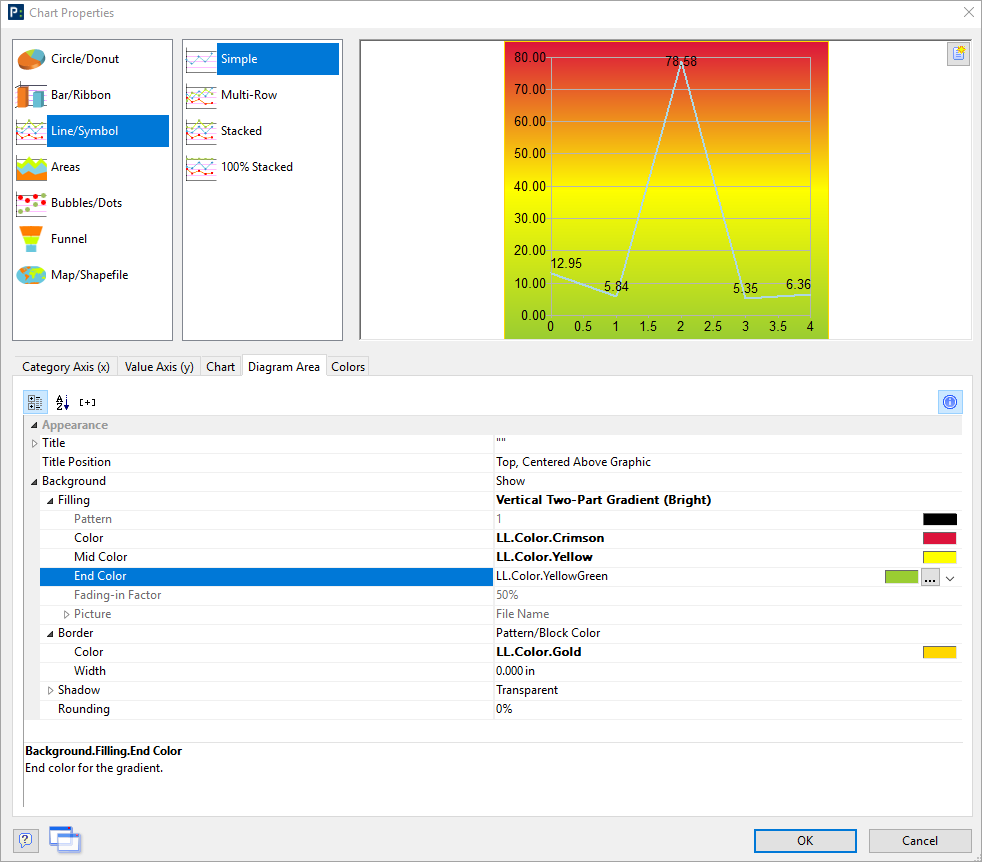
- Select vertical or vertical two-part style.
- Identify your desired colors in the color property fields.
- Click OK.