Using a previously saved query (or queries) from Analysis Expert, you can create custom reports that make it easy to review, print, save, and share important activity and incident information.
Add Text & Images to the Report
-
Log into Perspective.
-
Click Analyze and Report > Custom Reports > Add.

-
Enter a Report Name and Report Category.
-
Optional: Enter a description in the Report Description field.
-
Under Please select a query or queries for your report, select a query.
To select multiple queries, press and hold the Ctrl key on your keyboard while using your mouse to select the queries.

-
Click Design.
-
Click Insert > Text.

-
Click and drag to select a text area.

-
Click the Text tab.
-
Enter a title for the report in the text box.
- Click Insert.

If you need to edit the report title, click the
 Undo icon, enter your changes then click Insert.
 -
Click OK.
-
Use the settings in Font and Alignment from the Text tab to adjust the size, position, and appearance of the report title.

-
Complete steps 7-14 to add additional text (e.g. subtitles or company address).

-
Click Insert > Picture to add a company logo.
-
Click and drag to select an area for the image.

-
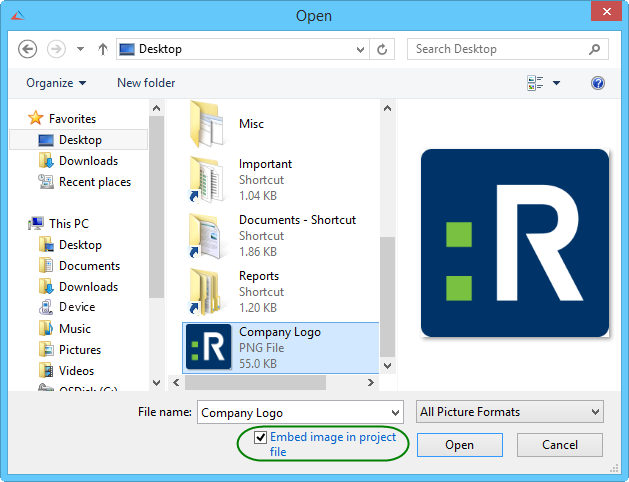
Click File.

-
Navigate to the location of the file.
-
Select the Embed image in project file checkbox to ensure other users will be able to view the image.
-
Click the image to select it then click Open.
-
Click and drag the logo to reposition on the page as needed.
Note: Click the Preview tab at the bottom of the screen at any time to see a preview of your report.
Insert the Report Container
The Report Container is the object that will display the data in your report. Report Containers can hold tables, charts, and crosstabs. The steps below provide instructions for adding a table only.
-
Click Insert > Report Container.
-
Click and drag to select the area where you’d like the table to appear.

-
Click Table from the Choose Element Type window.
-
Select the previously saved Analysis Expert query and click OK.

-
Expand the nodes in the Variables or fields that can be inserted section to reveal the variables or fields that can be added into the table as columns.

-
Double-click a field or variable to add it as a column.
-
Click the
 icon to remove a column or click the
  icons to rearrange the columns.
 -
Click OK.
Configure Objects & Layers
-
Ensure the Layout Preview tab is selected.
-
Right-click an object and click Assign to Layer.
-
Select First Page for objects that should appear on the cover page or select Following Pages for objects that should not appear on the cover page.

-
Click OK.
-
Repeat steps 1-4 for each object.
-
Click the Report Container object to select it.
-
Scroll down in the Properties section to locate Pagebreak Before.
-
Select Yes from the drop-down menu.

-
Click a blank area within the report to show the General Settings in the Properties pane.
-
In the Minimum Page Count field, delete 1 and enter 2.

-
Click the Preview tab to preview your report.

-
Click File > Save.
-
Click the X in the upper-right corner to close Perspective Report Designer.
Your new custom report will now appear in the Custom Reports section of Analyze and Report. Click the Execute button to view the report.
See also: